Close-up overhead view of a laptop screen displaying a complex analytics dashboard interface in Figma, multiple data panels visible, even studio lighting, dark desk surface visible at edges
/ Case Study — Dashboard

From data overload to decision clarity

A requirements-first audit that traced dashboard clutter to unresolved stakeholder assumptions — then resolved it through deliberate information hierarchy and high-fidelity prototyping.

Flat-lay overhead shot of a printed user requirements matrix spread on a white work table, sticky notes annotating rows, a pen resting at the edge, bright north-facing natural light
User Requirements Analysis

The clutter had a source — and it wasn't the users

Structured interviews and contextual observation revealed that most dashboard panels existed to satisfy internal stakeholder assumptions rather than documented user tasks. Users were navigating around the data, not with it.

A user requirements map separated confirmed needs from assumed ones — giving the team a shared, evidence-based baseline before any wireframe was drawn.

Wide environmental shot of a monitor showing low-fidelity wireframe layouts for a dashboard, hand-drawn annotation marks overlaid on screen, bright even studio lighting, minimal desk visible
Information Architecture

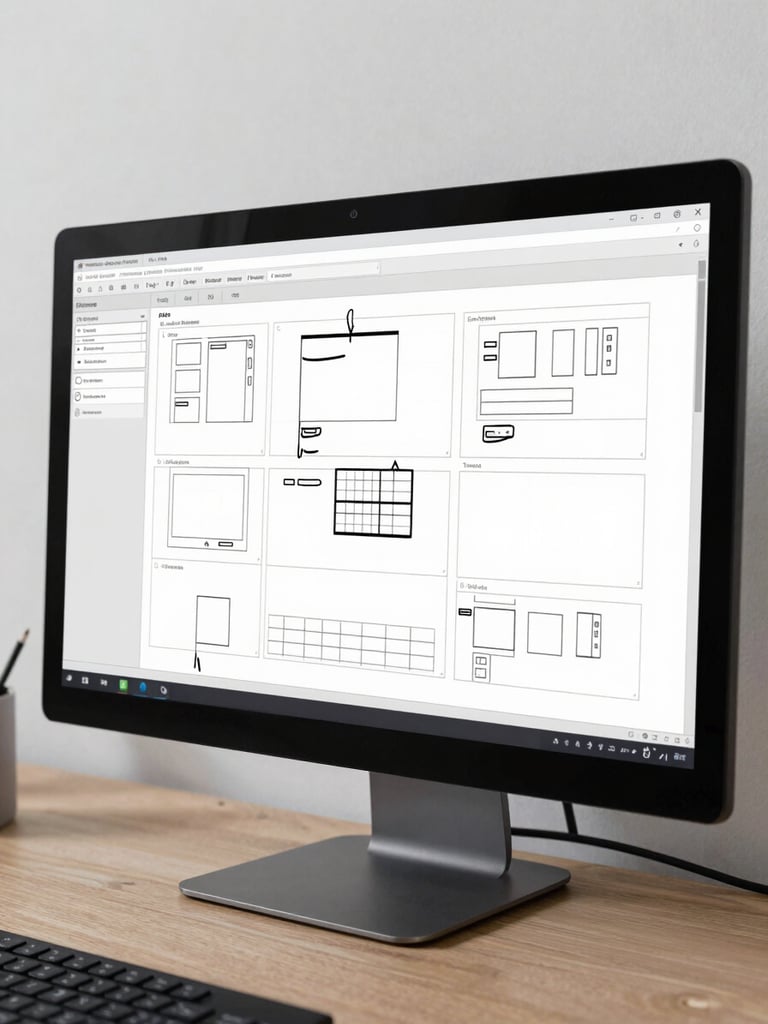
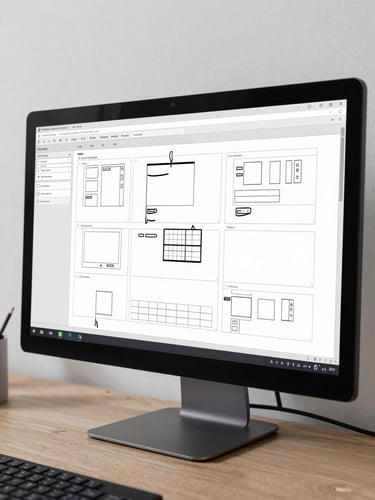
Hierarchy as cognitive load reduction

Wireframes established a strict hierarchy: actionable signals at the top tier, contextual data in the second, reference metrics behind progressive disclosure. Every panel placement was justified against a documented user task.

Cross-functional critique sessions used the wireframes as a decision log — each layout choice tied back to a specific finding from the requirements analysis.

Close-up of a large monitor displaying a polished high-fidelity Figma dashboard prototype with clearly differentiated data tiers and teal accent highlights, clean studio lighting, dark bezel framing the screen
High-Fidelity Prototype

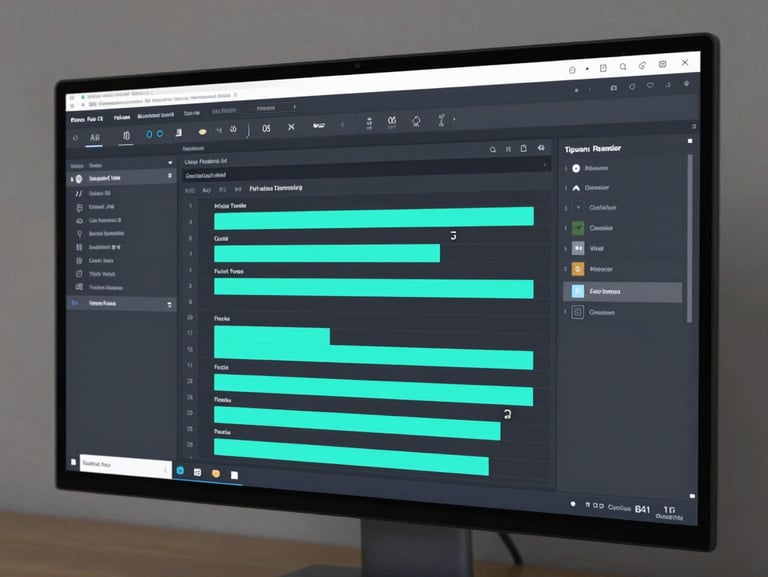
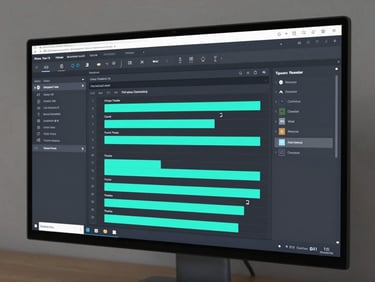
The prototype as a stakeholder alignment tool

The Figma prototype was built to surface trade-off decisions in real time — not to hand off pixel specs. Stakeholders navigated the live prototype during review sessions, making hierarchy choices visible and reversible before engineering began.